Every number in your report comes from your actual tradebook — not benchmarks, not averages. Your data, interpreted without comfort. Modules tagged Essentials ship in both tiers; the rest are Full Report-only.
📊
Year-wise Scorecard ESSENTIALS
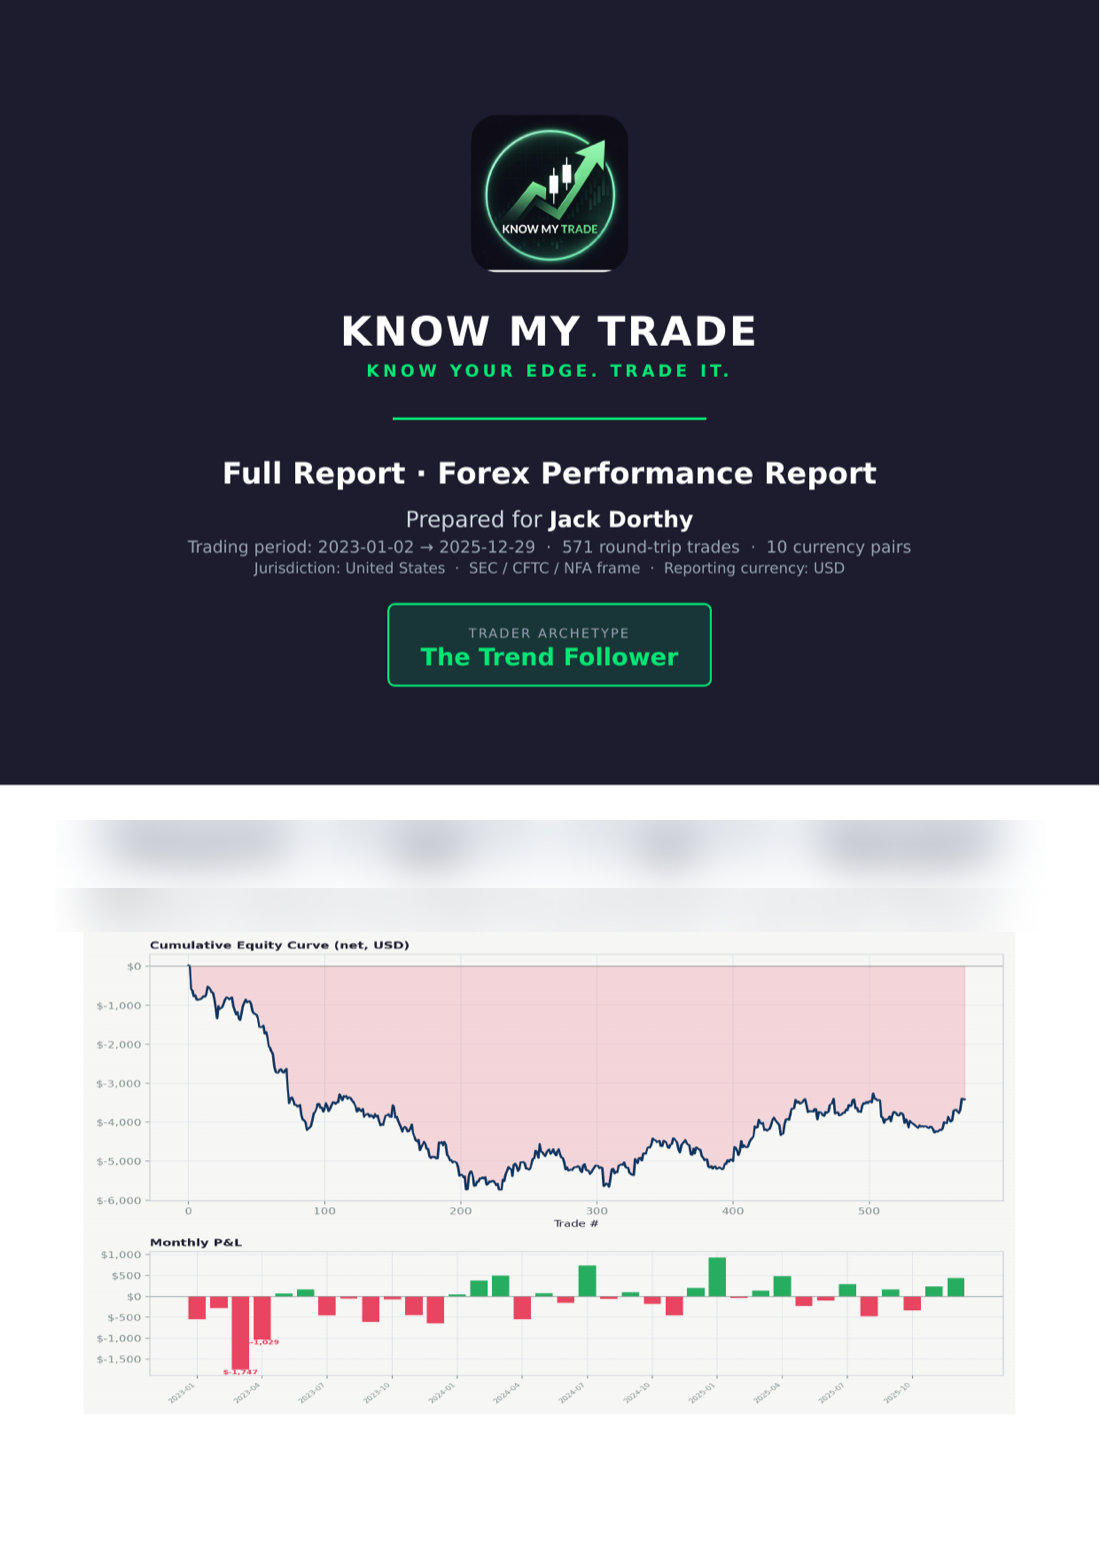
Trades, P&L, win rate, avg win/loss, R:R, max drawdown, and expectancy — broken down per year so you can see if you're actually improving.
🎯
Strategy Breakdown ESSENTIALS
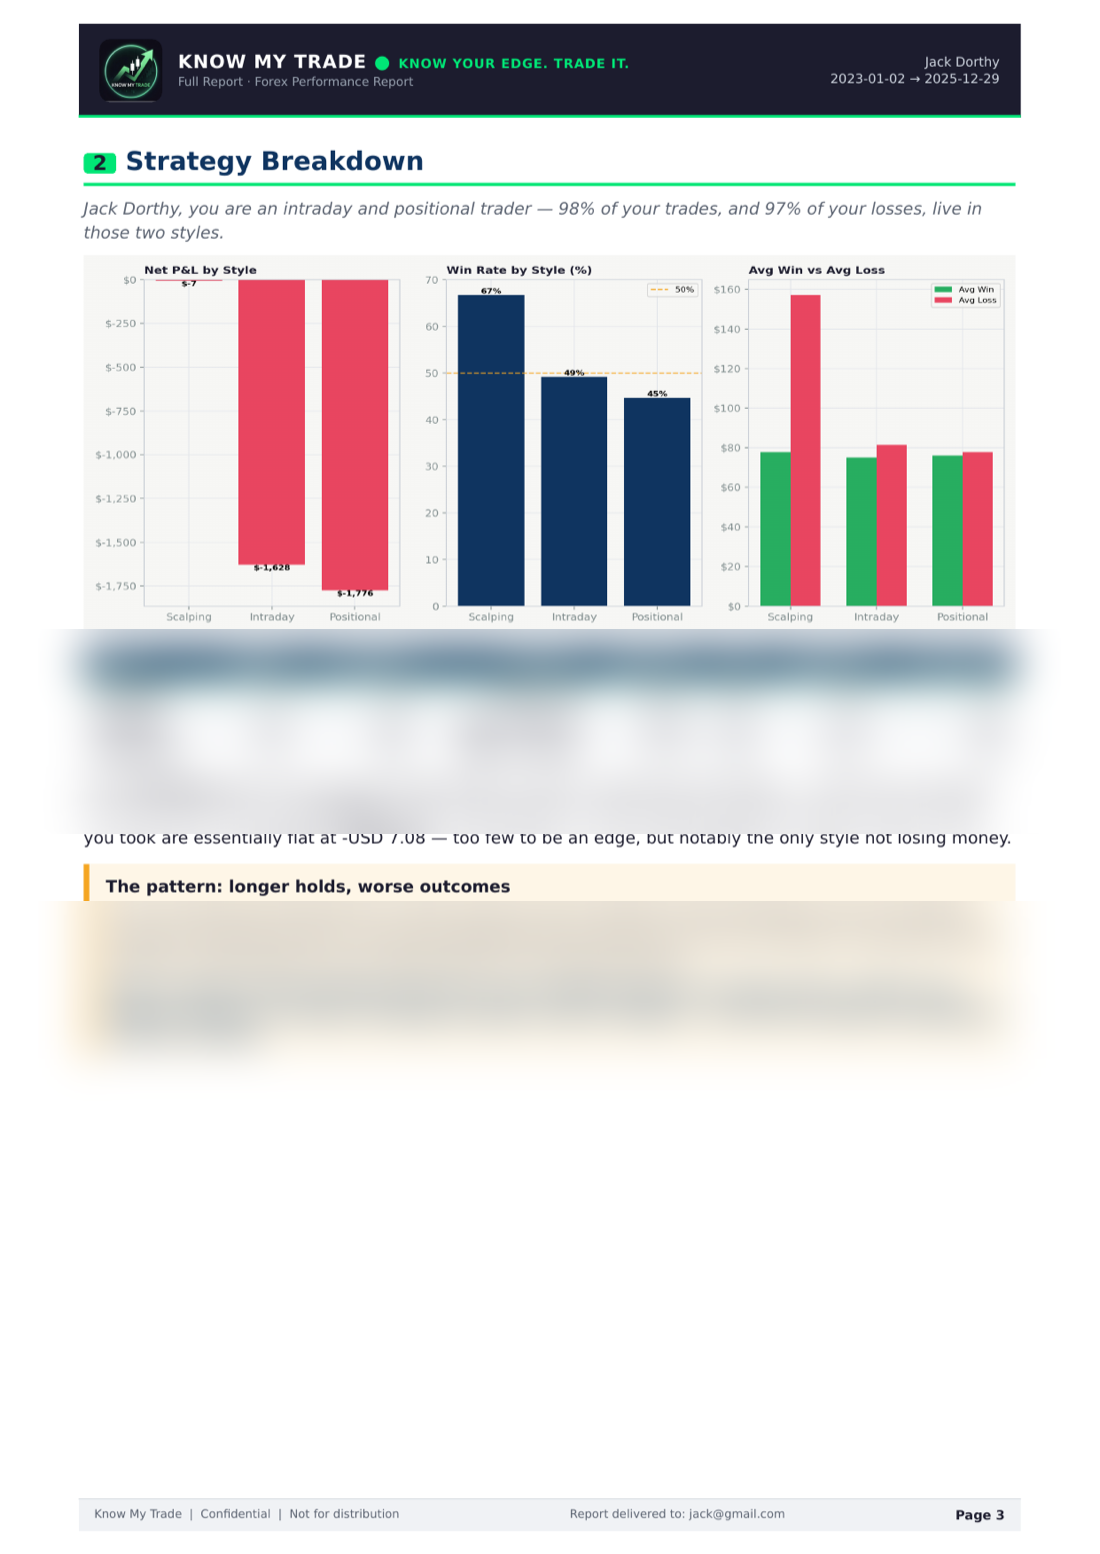
Scalping vs intraday vs positional vs swing — the full truth on where you make money and where you destroy it. Most traders are shocked by this section.
🧠
Behavioural Analysis ESSENTIALS
Hold-time asymmetry, loss aversion score, and R:R gap analysis. Do you cut winners too early and let losers run? The data will tell you.
📅
Timing Analysis ESSENTIALS
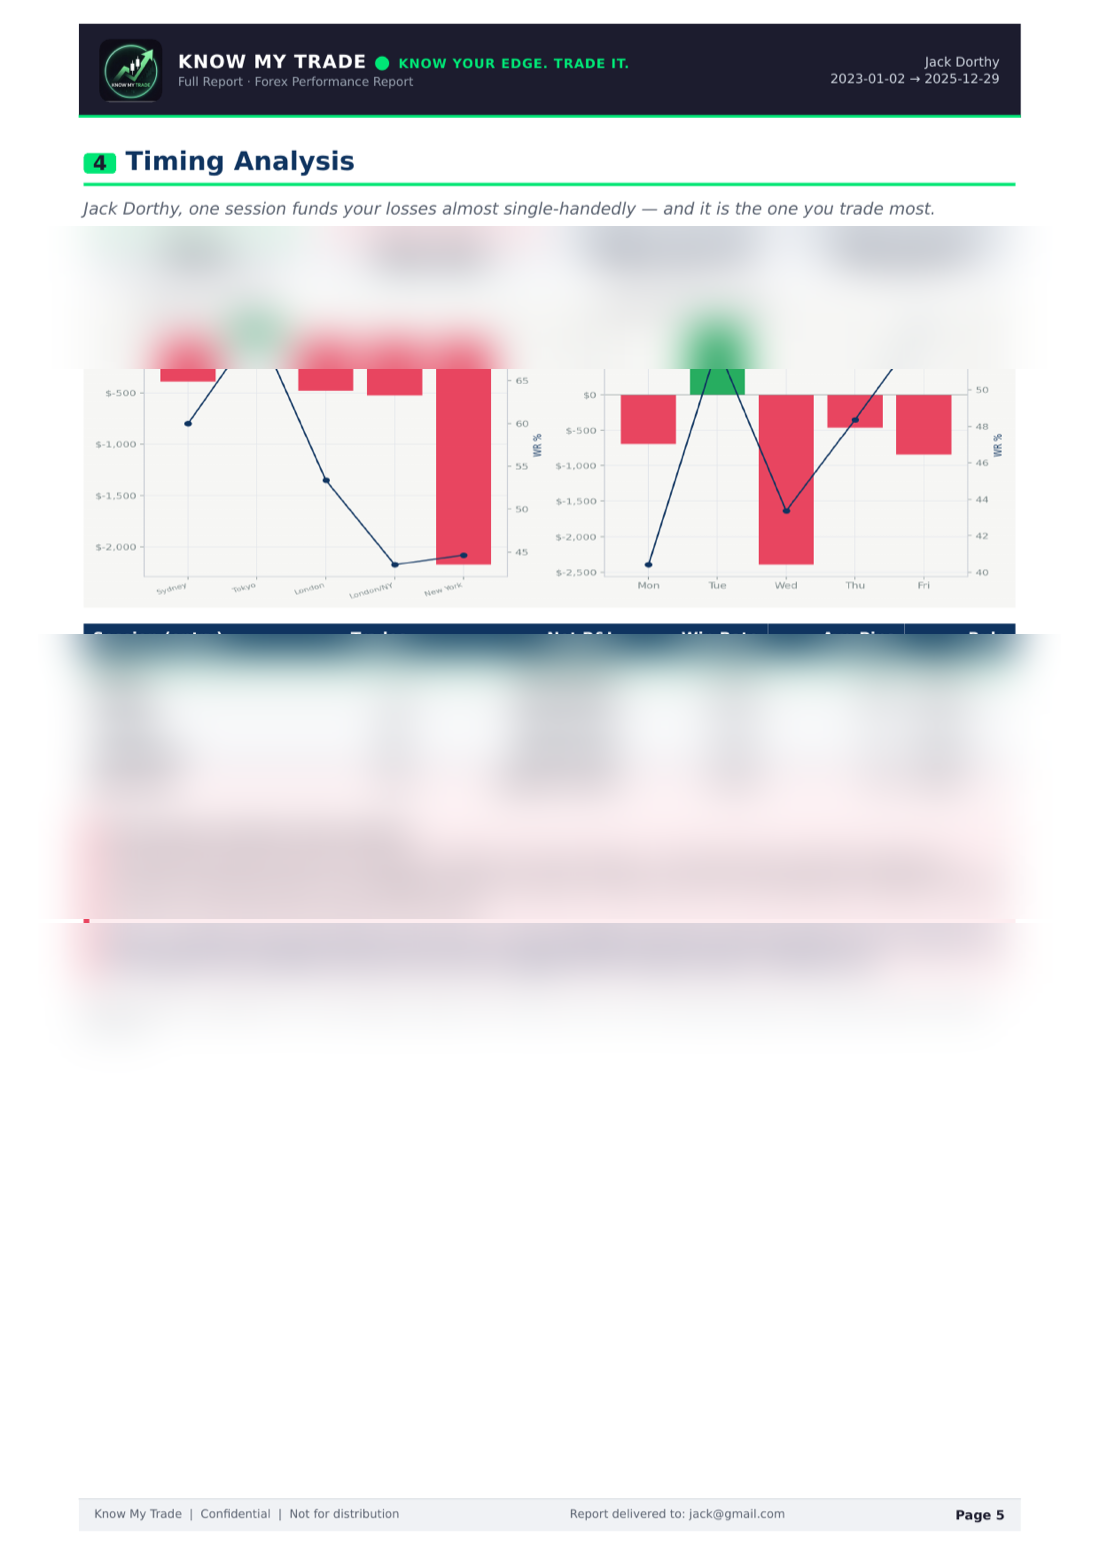
P&L and win rate by hour-of-day and day-of-week, in your local session window. Identifies your best and worst sessions down to the 60-minute slice.
📈
Overtrading Index ESSENTIALS
Correlation between your daily trade count and your daily P&L. Does trading more make you more — or lose more? One number answers this.
🗺️
Edge Map by Instrument ESSENTIALS
Every symbol you've traded, ranked by P&L and win rate. Where you have real edge vs where you've been guessing — across equities, F&O, FX, commodities, and crypto.
📆
Monthly Consistency ESSENTIALS
Green months vs red months, A/B/C consistency rating, and rolling 3-month trend. Are you getting more consistent or more erratic?
🏷️
Trader Archetype ESSENTIALS
Primary and secondary archetype computed from your data — The Scalper in Progress, The Compounder, The Drifter, and others. Shown on the cover.
💸
Cost & Fee Drag ESSENTIALS
How much of your gross profit is eaten by commissions, swap, and funding fees. Essentials gives you the headline number; the Full Report breaks it down by style, asset class, and fee type — and flags any style where fees exceed profit.
🔥
Streak & Tilt Detection
Your maximum losing run, revenge trading detection, and tilt-day identification. Understand what happens to your trading after a bad trade.
🪤
Disposition Effect
Do you cut winners too early and hold losers too long? Measured as the ratio of how long you hold losers versus winners — one of the most common and costly retail habits.
🧩
Edge Fragility Test
Is your profit real, or did a handful of outlier trades carry it? We recompute your net P&L with your top 5 trades removed and flag fragility if the edge collapses without them.
⚡
Moneyness Analysis options only
Deep OTM vs OTM vs ATM vs ITM performance. Are you consistently buying options that are too far out of the money? This will confirm it.
⏱️
Theta-Decay Trap F&O only
How much of your positional losses came from holding long options in the final week of expiry — when theta decay is maximal. Named and quantified.
🏦
Equity Depth equity only
Market-cap distribution, concentration risk (how much rides on a few names), and a holding-period tax-leak analysis tuned to your country.
💱
Forex Depth forex only
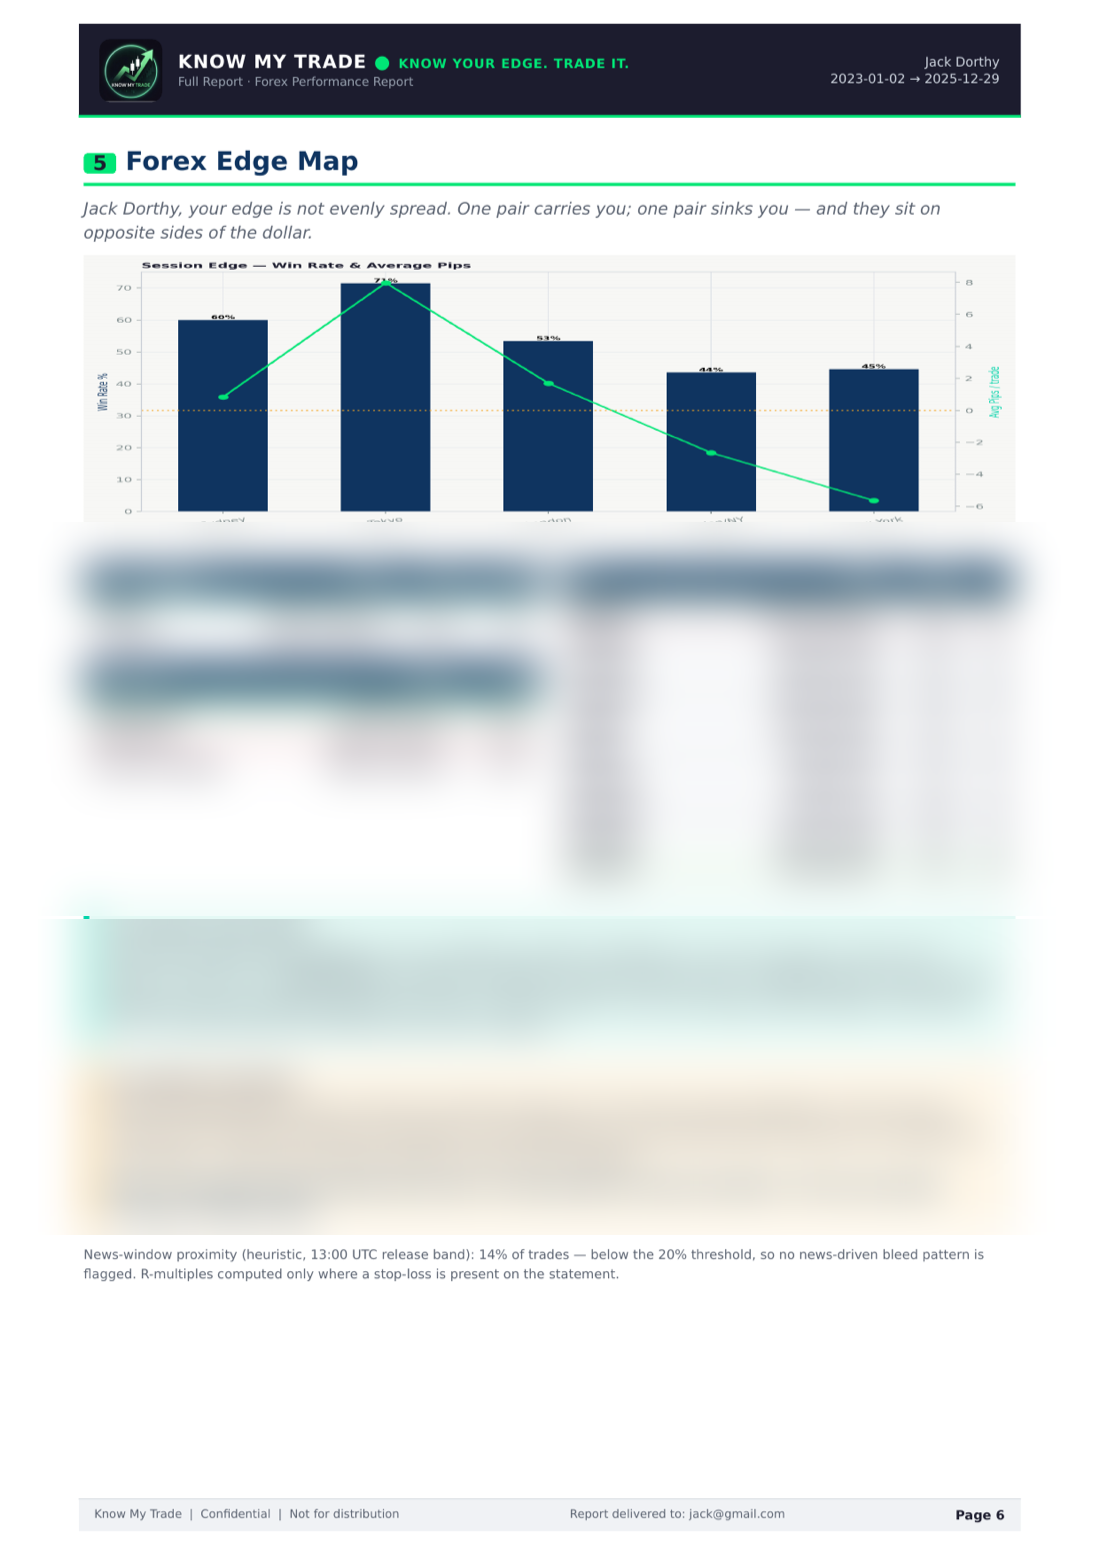
Trading-session edge, pip-based metrics, USD/DXY correlation, and proximity to scheduled news events. Where in the day and the calendar your FX edge actually lives.
🛢️
Commodity Depth commodity only
Roll cost / contango impact, inventory-release-day behaviour (crude Wed, natgas Thu), and seasonality patterns across the year.
🪙
Crypto Depth crypto only
Coin-category edge (BTC/ETH vs alts vs memes), spot-vs-perpetual breakdown, funding-fee bleed, volatility-regime edge, and 24/7 discipline — which hours quietly bleed you.
⚖️
Position-sizing Discipline
How much your trade sizes drift from your own baseline. Sigma-deviation flag on the trades where size, not setup, did the damage.
📐
Risk-adjusted Returns
Sortino, Sharpe, and Calmar computed on your daily-return series. Strip out the false comfort of nominal P&L and see what your edge really earns per unit of risk.
📈
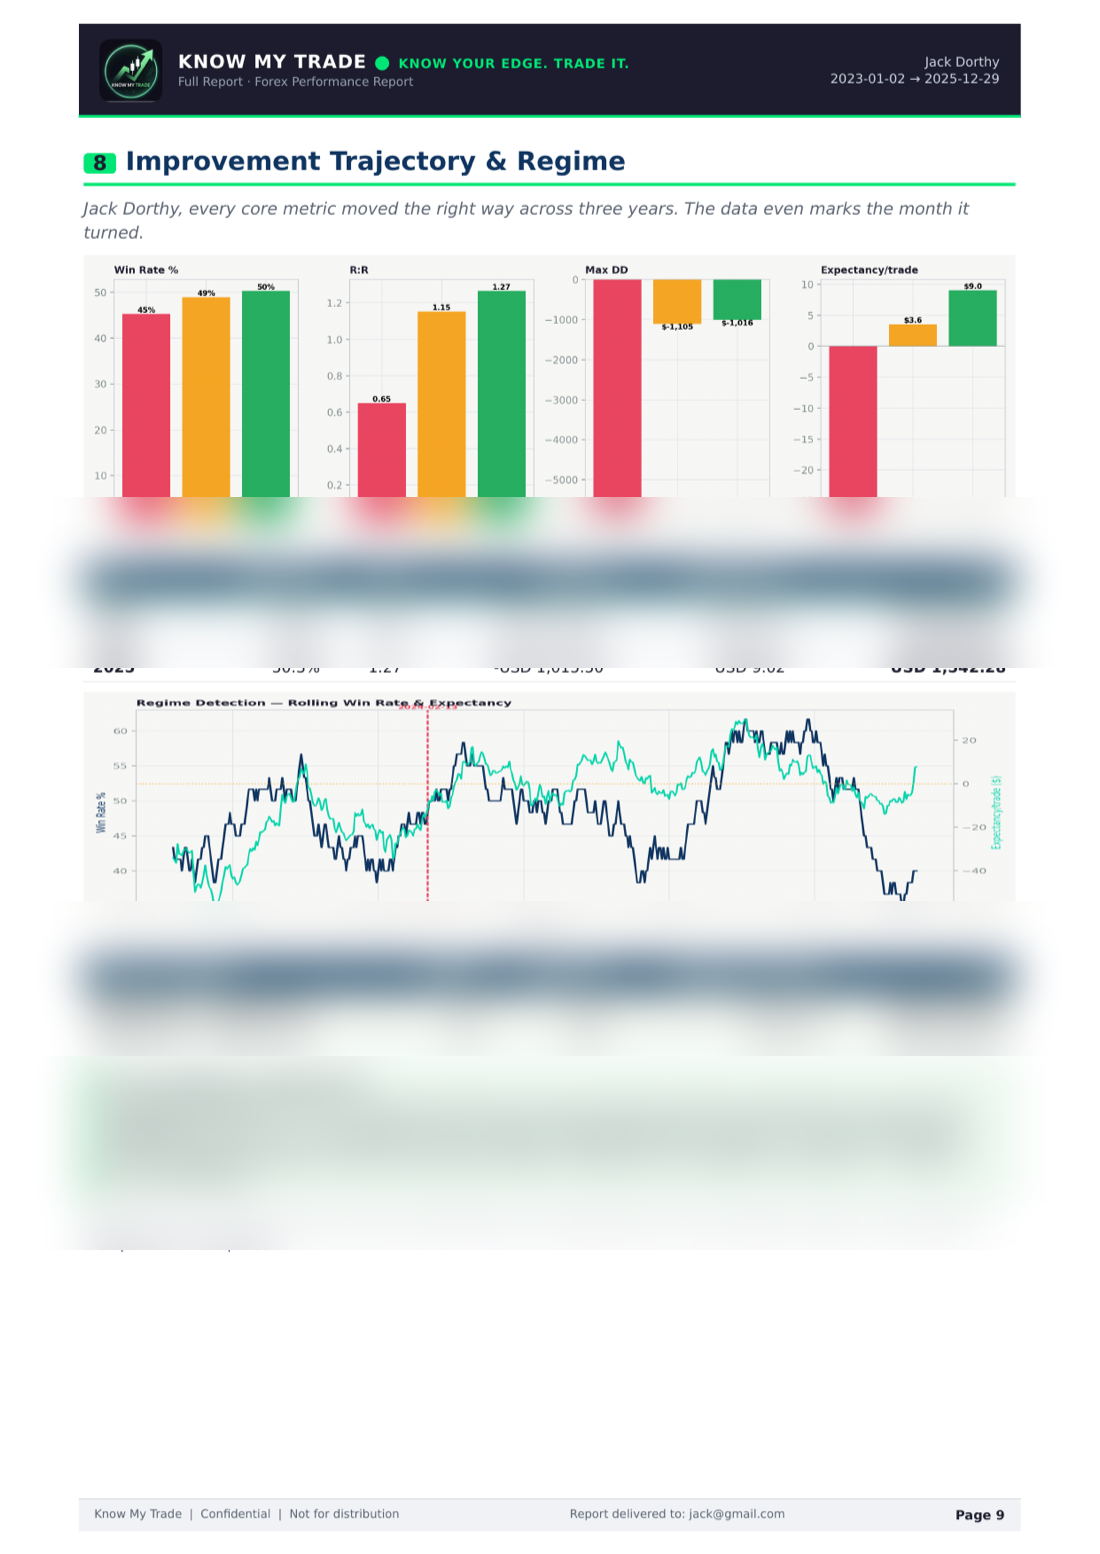
Improvement Trajectory 3-yr only
YoY metric movement across every tracked dimension. Are you actually getting better — or just changing what you're bad at?
🔀
Regime-Shift Detection 3-yr only
Pinpoints the date your performance structurally changed — for better or worse — and characterises the shift. Requires 3 years of data.
⚖️
Strengths & Weaknesses Scorecard
A two-column verdict: what to build on, what to fix — each with a specific, directional instruction drawn from your own data.
📜
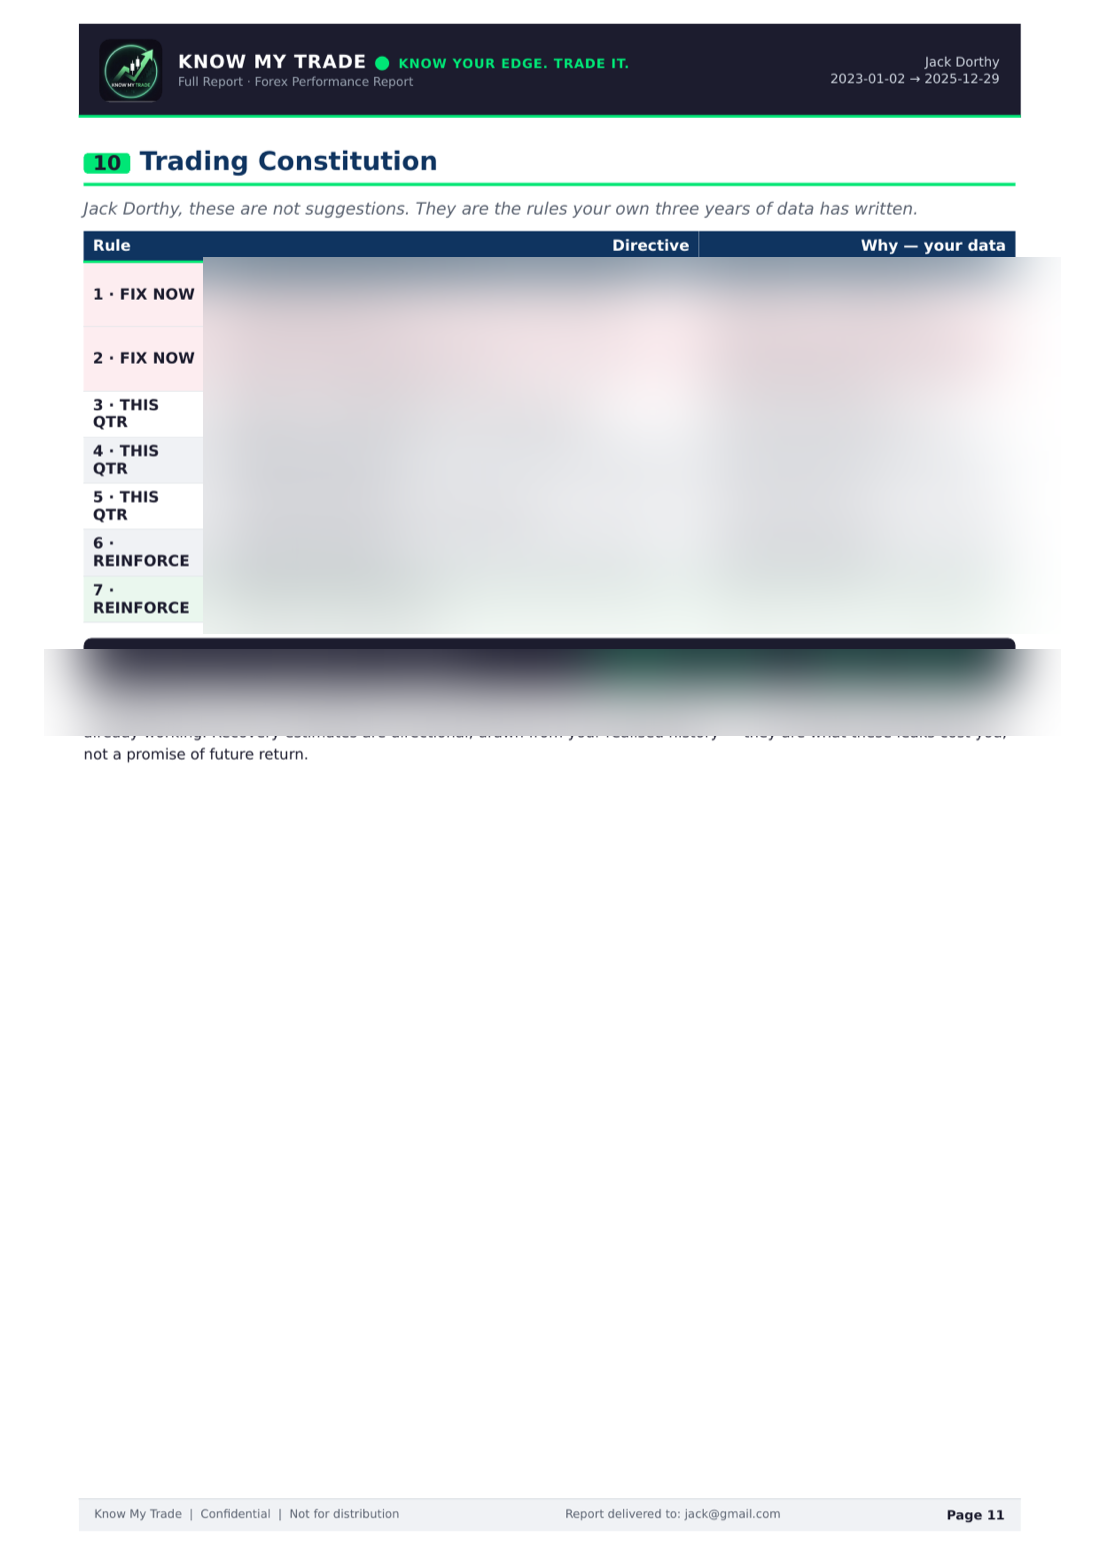
Your Trading Constitution
Every material rule, ranked by money impact, with urgency labels and an estimated recovery figure attached to each — written from your own data, not generic advice. (Essentials gets your top 3 priority fixes; the Full Report gives the complete Constitution.)